Wednesday, June 25, 2014
Labels:
data breach
,
disclosure
,
opinion
,
reporting standards
I think it's funny how
organizations are careful to craft public statements in the wake of data
breaches or public exposure that systems were compromised. For instance, the statement above, "no evidence that customer or consumer data
were reached or retrieved," appears to be put forth in an effort to
ease customer concerns. However, as an
information security professional, my first thought was to analyze that
statement through my jaded security lens.
Read More
We've Found No Evidence...Means What Exactly?
For its part, LexisNexis confirmed that the compromises appear to have begun in April of this year, but said it found “no evidence that customer or consumer data were reached or retrieved,” via the hacked systems. The company indicated that it was still in the process of investigating whether other systems on its network may have been compromised by the intrusion.Source: krebsonsecurity.com
 |
| Shucks, I can't find any evidence! |
Thinking critically though, "no evidence was found" could mean
quite a few things:
1) Logs were reviewed and no
exfiltration of sensitive data was observed
2) Systems were scanned with anti-virus and anti-malware software and were reported clean
3) No consumers have complained about their information being compromised (which is typically found by either a consumer having their personal account(s) hijacked and/or unauthorized charges on credit card or banking statements.
Log Analysis
As someone who troubleshoots
various networking issues, when someone tells me they've reviewed the logs and
found no evidence, my first thought is who QC'd the review? In complex security and/or networking issues,
I've found it's extremely helpful to have someone else either assist or vet
your work. We all have varying degrees
of experience and talent which influences the tedious work of analyzing log
files, packet traces, etc. and can result in one person easily noticing
something of interest while another person would miss it entirely.
Are there such certifications in
the area of log analysis? To my
knowledge, there's no industry accepted certification for log analysis like
there is in the way of other certifications like CISSP, Net+, or CEH. So, at most that leaves either a
vendor-specific certification, training, and/or experience.
With vendor-specific training, you
learn the basics of the device/software and maybe there's some advanced
training that takes you on a deeper dive of the product, but most of the time
such training doesn't teach someone how to analyze information and properly interpret the results.
Okay, what about training that
isn't vendor-specific? Now we're
getting somewhere. The type of training
here though would be akin to what an intelligence analyst has to do, which is
crawl through vast amounts of collected informaton to find connections and
correlations. Academically, it's tough to find such training. I did find a couple of related courses on Coursera:
Reasoning, Data Analysis and Writing
Statistics: Making Sense of Data
Reasoning, Data Analysis and Writing
Statistics: Making Sense of Data
Lastly, there's experience, where
over time you've learned to recognize such connections and correlations.
When companies suffer a data
breach, of course junior analysts can assist, but the effort should be overseen
by someone who has had analyst training and/or years of experience. How much experience? For the CISSP it takes five years of
experience and an endorsement, so maybe there could be something along those
lines established.
Scanned Systems
Next, we have the assumption that
machines were scanned and no evidence of malicious software was found. How many machines were scanned? With what tools were they scanned?
There are numerous reports of how
anti-virus based on signatures, although still necessary, is considered an
entry point in terms of an anti-virus defense.
It should be supplemented by software that scans for heuristics as
well. But lately, as Brian Krebs also
reports, there's an entire underground industry developing around the goal of
obfuscating malware payloads so they aren't recognizable. So, if scanning systems for viruses is now as basic an
action as is locking your front door, something more is needed.
This is an area where companies like Carbon Black, Crowd Strike, and Mandiant are making names for themselves. Although their tools are reactive in nature, they are oriented toward Incident Response and identifying the method of exploit and what systems and data were touched. Combining the output from those tools with the log analysis above should provide a picture of what systems and data were affected.
This is an area where companies like Carbon Black, Crowd Strike, and Mandiant are making names for themselves. Although their tools are reactive in nature, they are oriented toward Incident Response and identifying the method of exploit and what systems and data were touched. Combining the output from those tools with the log analysis above should provide a picture of what systems and data were affected.
Reporting Standards
If a company has performed both the log analysis and has the scanned system output, the next course of action would be public disclosure. This presents an issue though because if there is suspected criminal activity, law enforcement would be involved and the general rule is that information is prohibited from disclosure in ongoing investigations. However, just saying "no evidence found" isn't enough.
To address the issue on both fronts, disclosure standards should be defined so companies can incorporate those standards into their incident response plan. By the way, if you work for a company that doesn't have one, you might want to start building one now.
The U.S. does have data breach disclosure notification laws, but nothing specifying how the information should be presented to the public or what details can be included when law enforcement is or isn't involved. Have a look at the link above and you'll see most states have individual statutes specifying what constitutes sensitive data and when individuals should be notified. And even within that context, states handle data breach disclosure handling differently. A federal law would provide clear guidance for states to incorporate into their own codified laws and for companies to use when these events occur.
Maybe then we can get clarity on "no evidence was found"
 |
| Don't worry. Every company says they didn't find anything... |
Thursday, June 12, 2014
Labels:
back track 5
,
metasploit
,
postgresql

And we have to modify the database.yml file to reflect the new port value as well. While we're there though, why not change the default database credentials?
To test the connection, connect from another BackTrack/Kali session via these steps:
Read More
BackTrack 5r3: Make it a Team Effort
Background
In October 2012, I was prepping for our finals round in the Global CyberLympics competition (where we took 2nd place).
From previous practice sessions, my team and I agreed the best way to distribute information rapidly (and visually) among team members was to use Armitage's Team Server. At the same time, a couple team members had custom tools they wanted to use, which presented a problem: running those custom tools would not feed the results into the central Team Server instance. So, we needed a way to have them retain the ability to use their own stuff, but still share that information to everyone. Our solution was to identify one team member to not only run Armitage Team Server, but also make the Metasploit database externally accessible. Side note: for those not already familiar, the metasploit framework (msf) does not have a "free" GUI. Armitage was developed by Raphael Mudge to provide a GUI as well as enable easy team operations. Read more at Raph's Armitage website: fastandeasyhacking.com.
From previous practice sessions, my team and I agreed the best way to distribute information rapidly (and visually) among team members was to use Armitage's Team Server. At the same time, a couple team members had custom tools they wanted to use, which presented a problem: running those custom tools would not feed the results into the central Team Server instance. So, we needed a way to have them retain the ability to use their own stuff, but still share that information to everyone. Our solution was to identify one team member to not only run Armitage Team Server, but also make the Metasploit database externally accessible. Side note: for those not already familiar, the metasploit framework (msf) does not have a "free" GUI. Armitage was developed by Raphael Mudge to provide a GUI as well as enable easy team operations. Read more at Raph's Armitage website: fastandeasyhacking.com.
I also figured I'd change the default listening port and default database credentials since the database would be externally accessible. You can run Metasploit with different database management systems, but this article's focus is only if it's run on PostgreSQL.
Changing the default port
I decided to make the listening port a higher port, but because I was lazy, it went from 4444 (the default) to 44441.
NOTE: the default port varies depending on what BackTrack distro you're using. In the one I downloaded from the BackTrack Linux site, the default port was 4444. In the screen caps below I'm using a BT distro from Black Hat. To find out what port yours is listening on, run this command:
To change the port bindings, there are two areas where this can be modified, in the postgresql.conf and the setenv.sh files. Both files are in the directory /opt/metasploit/postgresql/, with postgresql.conf located in the ../postgresql/data directory and setevn.sh located in the ../postgresql/bin directory.
Many configuration settings are available in the postgresql.conf file, including an option to change the default port:

You can either change the port here, or if you notice at the bottom of the file, there's a message advising that settings that can be changed in the setenv.sh file instead. Since the port parameter is commented out in the postgresql.conf file, I suggest only focusing on the port value in the setenv.sh file. Change the PGPORT parameter to what you want:

NOTE: the default port varies depending on what BackTrack distro you're using. In the one I downloaded from the BackTrack Linux site, the default port was 4444. In the screen caps below I'm using a BT distro from Black Hat. To find out what port yours is listening on, run this command:
To change the port bindings, there are two areas where this can be modified, in the postgresql.conf and the setenv.sh files. Both files are in the directory /opt/metasploit/postgresql/, with postgresql.conf located in the ../postgresql/data directory and setevn.sh located in the ../postgresql/bin directory.
Many configuration settings are available in the postgresql.conf file, including an option to change the default port:
You can either change the port here, or if you notice at the bottom of the file, there's a message advising that settings that can be changed in the setenv.sh file instead. Since the port parameter is commented out in the postgresql.conf file, I suggest only focusing on the port value in the setenv.sh file. Change the PGPORT parameter to what you want:
There's one other area we need to amend to reference the new port value, and that's the postgresql startup script. This is located at:
/opt/metasploit/postgresql/scripts/ctl.sh

Change the port value to match what you set in the setenv.sh file.
Last step - either reboot to restart the postgres process, or restart it manually.
IMPORTANT!
Now that we've changed the PostgreSQL settings, we need to make metasploit framework aware by changing the postgres_port value in the metasploit properties file, located at:
/opt/metasploit/postgresql/scripts/ctl.sh
Change the port value to match what you set in the setenv.sh file.
Last step - either reboot to restart the postgres process, or restart it manually.
IMPORTANT!
Now that we've changed the PostgreSQL settings, we need to make metasploit framework aware by changing the postgres_port value in the metasploit properties file, located at:
/opt/metasploit/properties.ini
And we have to modify the database.yml file to reflect the new port value as well. While we're there though, why not change the default database credentials?
Changing default credentials
Navigate to /opt/metasploit/config
You can change the database credentials (and the port) by editing the database.yml file and changing the relevant parameters under the production header.

Once you change these settings and launch the metasploit framework console (msfconsole), enter the db_status command to verify database connectivity is successful. If you see an error, you may have missed a step above.

Once you change these settings and launch the metasploit framework console (msfconsole), enter the db_status command to verify database connectivity is successful. If you see an error, you may have missed a step above.
Modifying PostgreSQL: Listen externally
Change entries in
/opt/metasploit/postgresql/data/pg_hba.conf
The instructions advise you how new entries in the control list should be formatted:

The instructions advise you how new entries in the control list should be formatted:
When you scroll down, you'll see the lines specifying what connections the database permits. NOTE: I've added the second line under IPv4.

You can permit access to all databases (the first all), from all users (the second all), on all addresses. The line item I added allows external access to all databases from all users on all IP addresses this BackTrack instance, but you can make it more granular for tighter control by changing the database and user values to what you have in the database.yml file above. Furthermore, you could lock down the subnet or put multiple line items to allow only your teammates to connect.
Now we edit the file
/opt/metasploit/postgresql/data/postgresql.conf
Uncomment the line "listen_addresses". You'll need to change listen_addresses to '*':

Restart PostgreSQL or reboot and now you're listening for external connections!
End Result
Now you can accept external requests from others to log into your msf database, and the output from tools they run will populate your database.
To test the connection, connect from another BackTrack/Kali session via these steps:
- Launch msf console
- Type command string similar to "db_connect msf3:20394965@192.168.229.133:7338/msf3dev"
- db_connect, msf command to connect to another database
- msf3:20394965, username and hash set in the database.yml file above
- IP address of remote instance
- Port database is listening on
- /msf3dev, the name of the database to connect to
If you like this post and it works for you, or if you have any other related tweaks please let me know in the comments!
Friday, April 18, 2014
Labels:
CTF
,
forensics

These are the two clues provided to help you get started:


Read More
Write-Up: [SOLVED] SANS Easter Challenge - The Mystery of the Missing Easter Bunny
WARNING
Complete spoilers ahead! If you want to try the challenge first on your own, do not read this post. You've been warned.
Bunny-Napped!
Scenario: The Easter Bunny has been kidnapped, and YOU have to save him! Quickly collect yourself and help save him. Put on your detective hat and start investigating the clues provided.
These are the two clues provided to help you get started:
- An intercepted message from the bunny-nappers
- Ciphertext:
- Dsemvnqwlnmmzvi! Cc jagpbussnpwg tfgzvlroknt mlta cfwjgkr vqu phywl bfx kni Rxutrk Tztydi btsj lh tux asmhfesuygp qf gai Piiuii Zieoqrvlxd. Bxf gioqvkclf aegm ivgtkwfcwlyr fpmd btgxiubpdrw, xsidlw ku cbr! Vhngod nes cfav tlqd jhvv, ide M yutr fv wnl jfv. Xfvv ow geg fvgew xqsx fl xub Gafmic Kxbpckrtb: jtgi://ahe.ifglxiflnugbsya.dp/iryxro-ehneppvwf-xyk-qlpveer-sq-bxf-qzywvki-enlxpz-rvree/
- Hva aoh emvm yu? Pvgzr x eozfiyb qoh ckx zb mnbp :)
My Methodology
First try: the lazy way. I snagged the ciphertext and threw it in Decrypto by Blisstonia software in the hopes the answer would be solved by automation. No such luck.
Second try: experience based on past crypto challenges. I downloaded Cryptocrack, which I heard about in the CyberPatriot competition and ran it through a couple ciphers. Again, no such luck.
Winning try: tackling the mp3 first.
This Sounds Weird
After downloading the mp3, I listened to it, and it had that weird sound I can only describe as recognizing when something is played backwards. To see if that hunch was right, I downloaded Audacity and used the Reverse effect. Playing it after that effect revealed someone speaking letters in the NATO phonetic alphabet. When you record all the letters it instructs you to access a dropbox user content URL.
Image Analysis
Visiting the dropbox URL invokes a download of an image of John Malkovich holding a gun to a bunny's head. The file was a jpeg, so I figured there had to be something embedded in either the metadata or the picture itself via steganography. I didn't feel like downloading a piece of software for analysis, so I searched for photo forensics and came across this handy site: http://fotoforensics.com. Once you upload the picture and look at the metadata output, you'll see in the Comment field this description:
The ciphertext is created using the famous Vigenere cipher, once considered unbreakable. The key to reveal the cleartext is a combination of the a town located at the X Y coordinates where this picture was taken, and the make of the camera.
Obtaining the Vigenere Key
If you pop in the coordinates to mapping tools, you'll see it locates the town you need. Adding the town name only plus the make with no spaces provided the key.
Last Step
Deciphering the text reveals a URL for you to visit along with a message of thanks for assisting and instructions for you to let the Easter police know what you've found. When you visit the URL, you'll see a password prompt, into which you can enter the Vignere key and get a nice picture of the Easter Bunny waving and saying how thankful he is that you helped save him!
I submitted more details of my write-up in response to the challenge, but alas, I was too late. It was fun though! Thanks to the SANS folks to continue to provide these fun contests!
Tuesday, April 1, 2014
Labels:
security

Read More
Spring Cleaning the Security Settings
Clean Up Those Security Settings!
I Decided did at a minimum each Spring I would endeavor to review my security settings across websites, apps, browser, and devices to make sure all security switches were enabled to the fullest extent possible. I'm posting this entry as a cheat sheet of sorts to Quickly jump to security settings pages. If you're aware of other settings pages That should be added, please submit them in the comments below!
Last Update: 10 SEP 2014
Account Security
Enable Two-Factor Auth (list maintained by others)
Google Security Settings (make sure you're signed in)
Google Apps Connected (revoke access to the ones you no longer use)
Google Drive Apps (click on the settings gear, and click on "Manage Apps")
Google Location History (turn on / off)
Google Picasa Settings (that Affects your G+ photos)
Google Music (authorize / de-authorize devices)
Google Web History (tracks your searches)
YouTube (connected accounts)
GitHub (connected apps)
Twitter (connected apps)
Dropbox (connected devices)
Device Security
Amazon Registered Devices (Instant Video / Prime)
Browser Security
Friday, March 21, 2014
Labels:
packet analysis
,
Wireshark


Since the packet details are structured according to layer-specific information, I can quickly expand a collapsed section related to the target of my search. Pro-tip: this is where understanding networking and application behavior is really helpful. Don't worry if you're not familiar, because this is also what helps you learn how the packets are placed onto the wire. Let's dive into this one layer at a time.
What's funny about this part of the packet view is that if you take away the bracketed lines, there's not much info left! Interface ID, Encapsulation Type, Arrival Time, Epoch Time, Frame Number, Frame Length, and Capture Length. I'm still learning, of course, but what I've found is the most important is the Frame Number. When troubleshooting a network communication issue, it's extremely helpful to guide someone else through the packet capture using the Frame Number as a point of reference.

With or without expanding the Ethernet header, we can see the source MAC address and destination MAC address. This is handy when troubleshooting an outbound packet, because you can see where the packet was destined to reach. Typically, this destination MAC belongs to the default gateway, but it depends on the network topology.
What's nice in troubleshooting as well is that the first six hexadecimal digits are parsed by Wireshark to display the user-friendly NIC identifier, commonly referred to as the manufacturer's registered identification number. If you know your device, then you can easily recognize the packets sent and received by your device based on MAC. Why is this important? Load-balanced clusters that share a virtual IP address.

In the IP header, we see the source and destination IP addresses. When dealing with packets on WAN links, sometimes people utilize the DiffServ Code Point value (DSCP) as a Quality of Service mechanism to classify packets into prioritized buckets. Higher-priority packet buckets get processed first.

Focusing on the highlighted line in blue, we quickly see the source port and destination port. From those numbers, it's typically easy to recognize which is the sender and receiver. When a host sends a packet to another host, the port chosen on the source is a randomized ephemeral port higher than port 1024. The destination host in this case is a webserver, which makes sense since we're looking at an HTTP packet, and the destination port is 80 (the normal server port over which HTTP connections are established).
In the exploded view, we see the Flags section which indicates certain information related to the nature of the connection. For instance, the Push flag is set, which is an indicator that the packet should be processed up to Layer 7 because the source is sending data to the destination. In this packet, that data is the URL in the GET request. It's at this part of the packet attacks like the Christmas Tree attack are initiated against a webserver. This video explains it perfectly:

Expanding the HTTP layer, we see the formation of the GET request. Bonus points on my imaginary scoreboard if anyone can let me know in the comments whether the request is explicit or transparent. In the GET request, I can see the HTTP protocol version used (1.1) and the path of the request. The path in this packet is "/", meaning it was a request for the root web directory.
The Host Header instructs the server to send the root web directory back for www.msn.com. Can anyone guess why the Host Header is important? Think about it for a second, and then you can check your answer.
Below the Host Header, we can see other HTTP Request Headers the browser of the source host sent to the webserver. The ones to discuss are User-Agent, DNT, Accept, Accept-Encoding, and Accept-Language, but head on over to my HTTP Headers post if you're interested. In this here post, we're focusing on the packets!
At the very bottom of the HTTP layer of the packet, you can see some helpful bracketed information Wireshark parsed out for us. We can see the Full request URI, which means the request was observed as http://www.msn.com. And we see that the webserver responds to this packet [Frame 294, see above] in Frame 389. That allows you to scroll through the packet capture to Frame 389 to see what the server sent back.
Read More
Packet Analysis 101 - Wireshark's Packet Details
"The time has come," the Walrus said,You've already seen how to use Wireshark to take a packet capture, how to set capture filters, and how to set display filters. In this post, we're going to talk about Wireshark's Packet Details View.
"To talk of many things:
Of bits-and bytes-and frame headers--
Of trace routes-and pings...
Packet Details
What's nice about Wireshark's Packet Details View is that it parses out the packet in easy to read sections that map to the OSI model:Since the packet details are structured according to layer-specific information, I can quickly expand a collapsed section related to the target of my search. Pro-tip: this is where understanding networking and application behavior is really helpful. Don't worry if you're not familiar, because this is also what helps you learn how the packets are placed onto the wire. Let's dive into this one layer at a time.
Packet Frame Header
Let's expand the Frame Header line and see what we get.

Some important things to note first before we discuss too many details. When you expand a "layer" in the Packet Details View, anything in brackets is something not found in the actual packet, but is inserted by Wireshark during the loading of the packet capture. Fun stuff to note for later includes the time delta and coloring rule.What's funny about this part of the packet view is that if you take away the bracketed lines, there's not much info left! Interface ID, Encapsulation Type, Arrival Time, Epoch Time, Frame Number, Frame Length, and Capture Length. I'm still learning, of course, but what I've found is the most important is the Frame Number. When troubleshooting a network communication issue, it's extremely helpful to guide someone else through the packet capture using the Frame Number as a point of reference.
Ethernet Header (OSI Layer 2 - Datalink)
With or without expanding the Ethernet header, we can see the source MAC address and destination MAC address. This is handy when troubleshooting an outbound packet, because you can see where the packet was destined to reach. Typically, this destination MAC belongs to the default gateway, but it depends on the network topology.
What's nice in troubleshooting as well is that the first six hexadecimal digits are parsed by Wireshark to display the user-friendly NIC identifier, commonly referred to as the manufacturer's registered identification number. If you know your device, then you can easily recognize the packets sent and received by your device based on MAC. Why is this important? Load-balanced clusters that share a virtual IP address.
IP Header (Layer 3 - Network)
TCP Header (Layer 4 - Transport)
Because HTTP is a TCP-based protocol, we have a TCP header present.
Focusing on the highlighted line in blue, we quickly see the source port and destination port. From those numbers, it's typically easy to recognize which is the sender and receiver. When a host sends a packet to another host, the port chosen on the source is a randomized ephemeral port higher than port 1024. The destination host in this case is a webserver, which makes sense since we're looking at an HTTP packet, and the destination port is 80 (the normal server port over which HTTP connections are established).
In the exploded view, we see the Flags section which indicates certain information related to the nature of the connection. For instance, the Push flag is set, which is an indicator that the packet should be processed up to Layer 7 because the source is sending data to the destination. In this packet, that data is the URL in the GET request. It's at this part of the packet attacks like the Christmas Tree attack are initiated against a webserver. This video explains it perfectly:
HTTP (Layer 7 - Application)
At last, we see the application layer! This part of the packet can help us get a measure of what the source did and how the server may respond. In this packet we see HTTP, but in future posts we'll discuss other Layer 7 protocols and the communication involved.
The Host Header instructs the server to send the root web directory back for www.msn.com. Can anyone guess why the Host Header is important? Think about it for a second, and then you can check your answer.
Below the Host Header, we can see other HTTP Request Headers the browser of the source host sent to the webserver. The ones to discuss are User-Agent, DNT, Accept, Accept-Encoding, and Accept-Language, but head on over to my HTTP Headers post if you're interested. In this here post, we're focusing on the packets!
At the very bottom of the HTTP layer of the packet, you can see some helpful bracketed information Wireshark parsed out for us. We can see the Full request URI, which means the request was observed as http://www.msn.com. And we see that the webserver responds to this packet [Frame 294, see above] in Frame 389. That allows you to scroll through the packet capture to Frame 389 to see what the server sent back.
Conclusion
This post focused on a single HTTP packet and explained Wireshark's Packet Details View of that packet. If you have any questions or just want to let me know how awesome it was to read this post, please leave a comment below!
Labels:
headers
,
http
If you have questions about HTTP Host Headers, please let me know in the comments below!
Read More
HTTP Host Headers
Why are Host Headers important?
Host Headers are sent in the HTTP GET request to instruct the webserver to send content back for a specific website. This is necessary for webservers that host multiple websites (think shared hosting), so the hosting server can match the content to the Host Header and serve up what website.
Here's a video demonstrating multiple sites on a single IIS server and setting the associated Host Headers so the server knows which site to serve:
Check out how HTTP Host Headers look in a packet capture (scroll to the bottom).
If you have questions about HTTP Host Headers, please let me know in the comments below!
Wednesday, March 19, 2014
Labels:
CTF
,
maccdc


Read More
MACCDC 2014: Virtual Quals Lesson Learned
MACCDC 2014 - Virtual Qualifier Round
Some found my MACCDC 2013 write-up helpful, and more information is always better, so here's this year's lesson learned for the virtual qualifier round.
Choose a later time slot
This lesson is pretty subjective and I don't mean for it to sound negative or whiny, so please keep that in mind.
We chose one of the first time slots available this year in which to compete, and right after we were told "go!" we saw problems with the game infrastructure. The external IP addresses listed on the Flags tab were different than those listed on the Assets tab.
Here's a modified view of the Assets tab:
And here's the modified view of the Flags tab:
Struggling for Control
We connected to the external IP addresses on the Assets tab according to what team member was tasked to a respective system and tried to start the system hardening. Within the first 10 minutes, we noticed odd behavior that wasn't attributable to red team activity. We saw multiple sessions on Linux boxes and there were RDP battles on Windows. We then found out that our assets were swapped with those of another college! Once the game masters were aware of the issue, they started working on the fix.
In the mean time, all teams retained access to the systems to which they were connected. This meant that teams could still scour the systems to look for flag values to be submitted once the assets were re-aligned, as well as continue hardening their boxes. At this point, injects weren't assigned, so they weren't a concern.
Access Restored?
Once all machines were fixed in the scoreboard to be assigned to the correct teams, the games masters graciously reset the game clock. However, they did not reset the machines or the flags teams may have already captured. Of concern on that point is that according to the rules, whichever team submits flags first wins in the event of a tie. Well, with the start and end times now adjusted, we quickly went back to work.
Nope, Still Broken
Even after the game was reset, when we tried submitting flag values, they were not accepted by the scoreboard. The problem was that when you click on a flag to submit the value, although the main entry in the list was re-mapped correctly, the pop-up flag submission prompt still reported the old system. We had to take screen caps to prove what we were saying, as the game masters didn't believe us.
Conclusion
Now that you have a sense of the issues we were facing, I would recommend not choosing an initial time slot for fear of the game infrastructure being "buggy". The thought process behind this is that if your team chooses a later slot, then maybe by then the issues will be resolved and the game experience will be smooth. From a practical perspective, the time spent having to converse with the game masters about what is broken and why takes away time from your focus on system hardening, etc.
Something we found interesting is that not a single team from our round progressed to regionals...
Tuesday, March 18, 2014
Labels:
CTF
,
maccdc
Read More
MACCDC 2014: Sahana Eden Write-Up
This year, I was tasked to a linux box, even though my greater strength is in Windows. With the theme of this year's MACCDC being related to disaster recovery, I discovered the distro I had was Sahana Eden.

The tl;dr of this part is that I recommend once you learn of the MACCDC theme, look for related open-source linux distros (virtual appliances). Download a couple and mess around with them. Who knows, you might get lucky and pick the actual distro used in the qualifiers. At best, it will save you time once the competition starts and at worst you'll still learn to navigate your way around a linux box if you already aren't familiar.
What am I getting myself into?
Sahana Eden is, from their description:
... an Emergency Development ENvironment platform for rapid deployment of humanitarian response management. Its rich feature set can be rapidly customized to adapt to existing processes and integrate with existing systems to provide effective solutions for critical humanitarian needs management either prior to or during a crisis.If you'd like to download it yourself for experimentation, click here.
The Sahana Eden distro has webmin running by default, which coincidentally was a monitored service by the scorebot. Webmin, if you're not familiar (because I'd never seen it before!) is a web-based linux administration portal. By default, it was only accessible from internal addresses so you could only access it on the local host itself or from another asset. I debated trying to modify the configuration files to make it externally accessible, but since our Active Directory guy had his system set already I used his box to look at the webmin portal for anything useful. One less external vector for the red team, right? Since I'd never seen it, I originally assumed it was the web-app itself. Once I figured out that it wasn't, I was able to re-focus my attention on getting Sahana Eden up and running.
Sahana Eden Administration
First, let me say that the Sahana Eden documentation in terms of administration is not something you want to have to weed through during competition time, because the paths listed on the turnkeylinux site and the wiki are confusing and potential time-wasters.
The screenshot for Sahana Eden administration shows it being accessible via Web2Py:
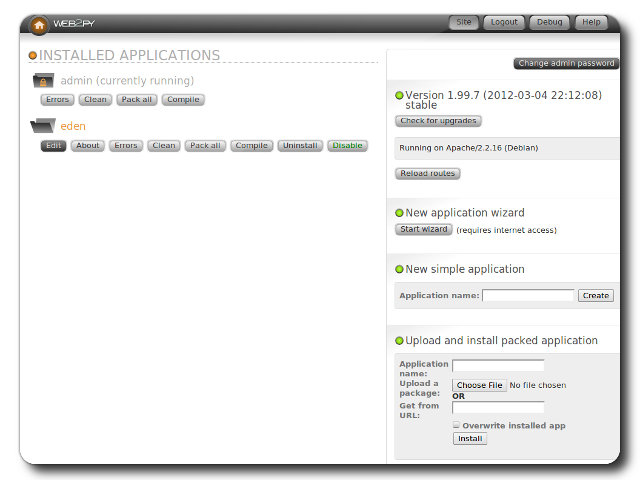

The screenshot for Sahana Eden administration shows it being accessible via Web2Py:
To clarify though, this isn't really web-app administration in the sense of application-specific settings. It's more about installing the eden app itself. So where then do you go to manage the app? Many web-apps have an administration portal off the customer-facing component, which is accessible after you log in. The customer-facing portal of Sahana Eden looks like this:
According to the turnkey linux page:
first registered user will become the administrative user account
Seems simple, right? Riiiiiiiight... Attempting to create a user resulted in a database error. That means I need to fix the database issue before I can register a user so that I can get into the web-app!
Sahana Eden's DBMS
By default, when you launch the /var/www/web2py main script, you'll see a note in the loading banner that unless otherwise specified in the config files the database management system will be sqlite3. When I checked, sqlite wasn't installed, hence the failure.
I did notice however that mysql was installed, and it happened to have an empty eden database. My guess is that the distro has the eden database in mysql preset via the web2py console. The questions then are: (1) how to point the web2py config files to use mysql instead of sqlite3, and (2) how to populate the database with what's necessary to create the admin account.
To save time, just go to the Wiki's Virtual Machine Installation Guide and scroll down to the Next Steps section. We need to modify two files:
web2py/applications/eden/models/000_config.py
web2py/applications/eden/models/zzz_1st_run.py
The config.py file has all settings necessary to point web2py to use the mysql instance, so you can make the necessary changes there (NOTE: I backed up the existing file first to have something to revert to).
The 1st_run.py file will generate the tables, etc. in the mysql instance.
After re-launching web2py, the app will now be pointed to an installed DBMS and allow you to create the user, so you can then take a look around at the app and maybe complete an inject or two. wink, wink
Good Luck!
Tuesday, February 18, 2014
Labels:
packet analysis
,
Wireshark
Packet Analysis 101 - Wireshark Display Filters
Now that you're familiar with capture filters, let's discuss display filters.
For another great cheat sheet that prints great and looks good in a binder or on your cube wall, check out PacketLife.net's Wireshark Display Filters.
While you're there, be sure to download the tcpdump cheat sheet as well! We'll be visiting PacketLife.net much more in future posts.

Read More
 |
| It's a port scan! |
Display Filters
Display filters can be applied during a live packet capture, as well as when reviewing an old packet capture like the one above (provided for the MDC3 forensics qualifying round).
See the Filter field above? That's where we build our expression to sift through the collected packets to display only those we're interested in reviewing. The syntax for these expressions is different than those discussed in the capture filters post. Here's an example of what I mean:
| Capture Filter | host 192.168.152.150 | |
|---|---|---|
| Display Filter | ip.src==192.168.152.150 |
See how much more specific display filters can be? In the example above, not only are we identifying a host, we're saying we want to view all packets where that host is the source. Using the same port scan pcap above, applying that display filter results in this:

Um, Cheat Sheets Please?
So, where do we go from here? Learn the display filters! Here are some examples to get you started:| Packets with port 443 | tcp.port==443 | |
|---|---|---|
| Packets with destination port 443 | tcp.dstport==443 | |
| HTTP GET requests | http contains GET | |
| 401 authentication challenges | http contains 401 | |
| Java user-agent strings | http.user_agent contains Java | |
| Packets to and from a host | ip.addr==192.168.152.150 | |
| SSL Certificates | ssl.handshake.certificate | |
 |
| PacketLife.net - Wireshark Display Filters |
More on Expression Syntax
In my few examples above, you may notice a pattern or two. The display filter begins with an argument identifier (ip, http, ssl, tcp) and can be used by itself or modified.
Using arguments by themselves is a great way to quickly sift through protocol-specific segments of a pcap. For instance, if I'm troubleshooting a DNS issue, all I have to type is dns in the filter and all other protocols are excluded.
These arguments have tons of modifiers. Take http for example. Open up Wireshark and type http followed by a period "." Wireshark recognizes that you're about to modify the filter argument and will show you a list of what's available.
To see a more comprehensive (and intimidating) list of what's available, click on the "Expression..." button. Go ahead, I dare ya.
Switching Display Filters
The last piece to remember when using display filters is that after you apply your expression, you have to clear it out to go back to viewing the previously filter-excluded packets. Give it a shot. Take a packet capture, filter for http and then filter for dns.
Next up, we'll be looking at individual packets! I know you're as excited as I am...
Friday, January 31, 2014
Labels:
packet analysis
,
Wireshark
Packet Analysis 101 - Wireshark Capture Filters
We're going to first discuss one of the two types of filtering available with Wireshark: capture filters. Before I go any further, if you're confused about what filters are and/or what Wireshark is, check out my first blog post to learn how to take a packet capture.

To set a capture filter, look for the Capture Options button on the left side underneath the interface listing. In the pop-up window, look for the Capture Filter option on the left and when you click it you'll see the short list of pre-defined capture filters.

You can select one of the templates and modify it to target the data you're hunting/troubleshooting.
Note the other parameters you can set, such as a time or size limit. When you modify a filter template or enter your own expression (based on those allowed), until it's in the proper syntax, Wireshark will highlight the Capture Filter field in red. Once you set the capture filter and click Start, Wireshark will begin monitoring the chosen interface using that capture criteria.
It's important to note that the capture filters are a different syntax than the display filters, and they're based on tcpdump filters. Check out a list of some sample capture filters.
When you open the capture filter list again, your new entry will be there! As I collect use cases for capture filters, I'll post a page with an index for easy reference.
Next up, we'll be discussing display filters.
Read More
Capture Filters
An often underused (where's the love?) component of Wireshark is the capture filter. Most people fire up Wireshark, select an interface and start capturing everything. That's great unless you have a scenario where you need to leave a capture running for a long period of time and/or have to sift through a huge amount of packets. Side note: This is also extremely handy in the Capture the Packet CTF.
To set a capture filter, look for the Capture Options button on the left side underneath the interface listing. In the pop-up window, look for the Capture Filter option on the left and when you click it you'll see the short list of pre-defined capture filters.
You can select one of the templates and modify it to target the data you're hunting/troubleshooting.
 |
| Selecting the template |
 |
| Changing the default value from "192.168.0.1" to 172.16.90.101 |
It's important to note that the capture filters are a different syntax than the display filters, and they're based on tcpdump filters. Check out a list of some sample capture filters.
Create Your Own Capture Filter
To create your own filter, when you have the Capture Filter pop-up open, click on New. Change the Filter name and Filter string fields to the values you want, and click OK. |
| This example looks for HTTP GET requests, excerpted from the Wireshark Capture Filter wiki page |
Next up, we'll be discussing display filters.
Tuesday, January 28, 2014
Labels:
packet analysis
Ten years ago, when someone couldn't check their email or perform a web-based task, it was always a question of whether the server was actually receiving power. These days, servers have drastically increased their availability so that server-specific outages have become rare. That fact means the blame when an application doesn't work typically falls on a device in the network boundary, and more often than not, the proxy and/or firewall.
So, how do you figure out where to target your efforts if your network looks like this?
Read More
Packet Analysis 101 - Initiating the Capture
Let's Look at the Packets!
How often have you heard, "This application isn't working. Is it the [IPS/IDS/Proxy/Firewall] again?"Ten years ago, when someone couldn't check their email or perform a web-based task, it was always a question of whether the server was actually receiving power. These days, servers have drastically increased their availability so that server-specific outages have become rare. That fact means the blame when an application doesn't work typically falls on a device in the network boundary, and more often than not, the proxy and/or firewall.
So, how do you figure out where to target your efforts if your network looks like this?
 |
| Only a slight exaggeration... |
Obviously there are other elements to troubleshoot, but it's often helpful and sometimes required to take a packet capture.
What is a Packet?
A packet is a binary package (001010101010) of information capable of being transmitted across the network from one device to another. We'll get into some specific examples in later posts. Packets have multiple layers, often referred to in sections as headers and footers. The headers contain transmission-related information with the footer containing the application data.
A common reference for packet header analysis is the SANS TCP/IP and tcpdump cheat sheet. The image below shows excerpts including the Ethernet header (OSI Layer 2), the IP header (OSI Layer 3), and the TCP header (OSI Layer 4).
 |
| TCP/IP headers from SANS, with Ethernet added by me |
Notice how I arranged the header in layers. These layers follow the abstract, but logical, OSI model. It's also helpful to recognize them this way when you analyze packets from a capture.
What is a Packet Capture?
A packet capture is exactly what it sounds like, although some people refer to it as "packet sniffing". It's a collection of network packets transmitted by and/or between any number of combinations of such devices as those in the nightmare diagram above. The next logical question is...
How do I Capture Packets?
People more commonly ask, "How do I take a packet capture?" To do so, we need a tool. For the express purpose of capturing packets, several are available including: Wireshark (my fav), Network Miner, NetWitness Investigator (Direct Download Link), Microsoft Network Monitor, and Capsa. They all have unique attributes and capabilities, so I suggest experimenting with them to find out which one you prefer.
To get you started, our friends over at Hak5's YouTube channel made a great introductory video using Wireshark:
Although there are video tutorials on the other tools, those videos focus more on the use of the tool rather than initiating a capture using the tool. If I find them, I'll post them, but in the mean time check out Wireshark!
Sunday, January 12, 2014
Labels:
HTTPS
,
SSL
HTTPS, SSL, and [Perfect] Forward Secrecy
The events of 2013 have raised awareness about the capability to eavesdrop on Internet conversations many thought were protected from eavesdropping. There are many articles about HTTPS, SSL, and [Perfect] Forward Secrecy, but I've found that none really reference the information in a visual way. Since we're all primarily visual creatures, I think it would be helpful to some to post a more visual-oriented reference to this discussion.
The Basics
First, a review of the OSI model. This model sets out a visual representation of what happens when information is transmitted from one system to another, such as when your home computer, laptop, or tablet loads a web page. Think of the OSI model as an information workflow process that systems use to either receive data or send it out. The model is organized into 7 layers, depicted here:

The mechanisms of HTTPS, SSL, and Perfect Forward Secrecy take place at the top three layers: Application, Presentation, and Session. More specifically, and for the sake of simplification, we'll say they happen at the Application and Session layers.
When you sit down at your machine and are ready to perform some online banking or shopping, this is what typically happens. You type in your bank's website, and your machine sends an HTTP request to the banking or ecommerce site.

It's at this stage where the bank or ecommerce site will send a redirect message to your browser (Internet Explorer, Chrome, Firefox, etc) providing instructions to contact the server back using an HTTPS request. Let's narrow our scope down on that part of the conversation:

When communicating sensitive information such as banking (account numbers) or ecommerce (credit card numbers), we don't want that data to be passed "in the clear" because someone could easily see what we're typing. Banks and retail stores don't want to be held accountable for letting someone steal your data, so they attempt to secure the communication when you access the portal. That's why in the graphic above, when you send a "clear text" request, the organization's server will typically send your browser an instruction to send a new request in a secure way. The browser knows where that new location is via the location response header.
Now our browser will begin secure communication negotiation with the banking or ecommerce server. Before the browser sends the request for the web page again, it establishes an agreed-upon secure communication method with the server.

Notice how in the graphic above I only focus on the SSL part of the conversation? It's important to note that SSL is independent of the HTTP application protocol. You can send other types of traffic over SSL such as File Transfer Protocol, Internet Content Adaptation Protocol, and Simple Mail Transfer Protocol. When we think of our banking and ecommerce sites, we always see the https, which is HTTP over SSL. Below is an illustration, using the same example above:

The Details
Now on to [Perfect] Forward Secrecy. What exactly does it mean, and why do I bracket out the "Perfect"? Perfect Forward Secrecy (PFS) is a level up from Forward Secrecy (FS), and both are improved where no implementation at all is used.
How do they protect the encrypted traffic? Using the Diffie-Hellman exchange, they ensure that the keys exchanged between "Home PCs" and servers are done so in a secure manner. It's a psuedo-randomization of the session key so that the asymmetric keys can be exchanged.
To clarify, in the picture above where we see the SSL session established, without using PFS or FS the server would not randomize the keys, using the same keys in conversations with however many "Home PCs" wanted to communicate.
The danger of handling encryption/decryption of SSL messages this way is that if the private key is compromised in anyway, all traffic collected using this keyring could then be decrypted.
Using Forward Secrecy, each conversation with each different "Home PC" would use the Diffie Hellman algorithm set to generate random session keys to determine the secure key exhange of the RSA keyring. Because the key exchange mechanism is different per "Home PC", gaining access to the private RSA key would have to be run through the Diffie-Hellman algorithm to find the key exchange used for each session.

Now, running the recovered (hacked?) private key along with the Diffie-Hellman algorithm would only reveal communication between that one "Home PC" the key was cracked for and the server.
And lastly, Perfect Forward Secrecy uses different session keys within the same conversation with each "Home PC" so that multiple keys are used per conversation:

So, what does this mean in terms of security?
We eliminate the capability of someone without key-breaking tools to eavesdrop when we switch from HTTP to HTTPS. SSL without PFS or FS means that if someone is able to crack the key used, then they have access to all conversations between that server and all systems with which it communicates. SSL with Forward Secrecy operations prevent all conversations from being monitored by the cracking of one key, but if someone does crack that key, then they would get access to all conversations between that server and one endpoint. Finally, SSL with Perfect Forward Secrecy ratchets up the difficulty even more, because now an eavesdropper must crack multiple keys within a single conversation.
The focus here is the number of keys involved, and increasing the number of keys increases the time it takes to break those keys.
Self Assessment
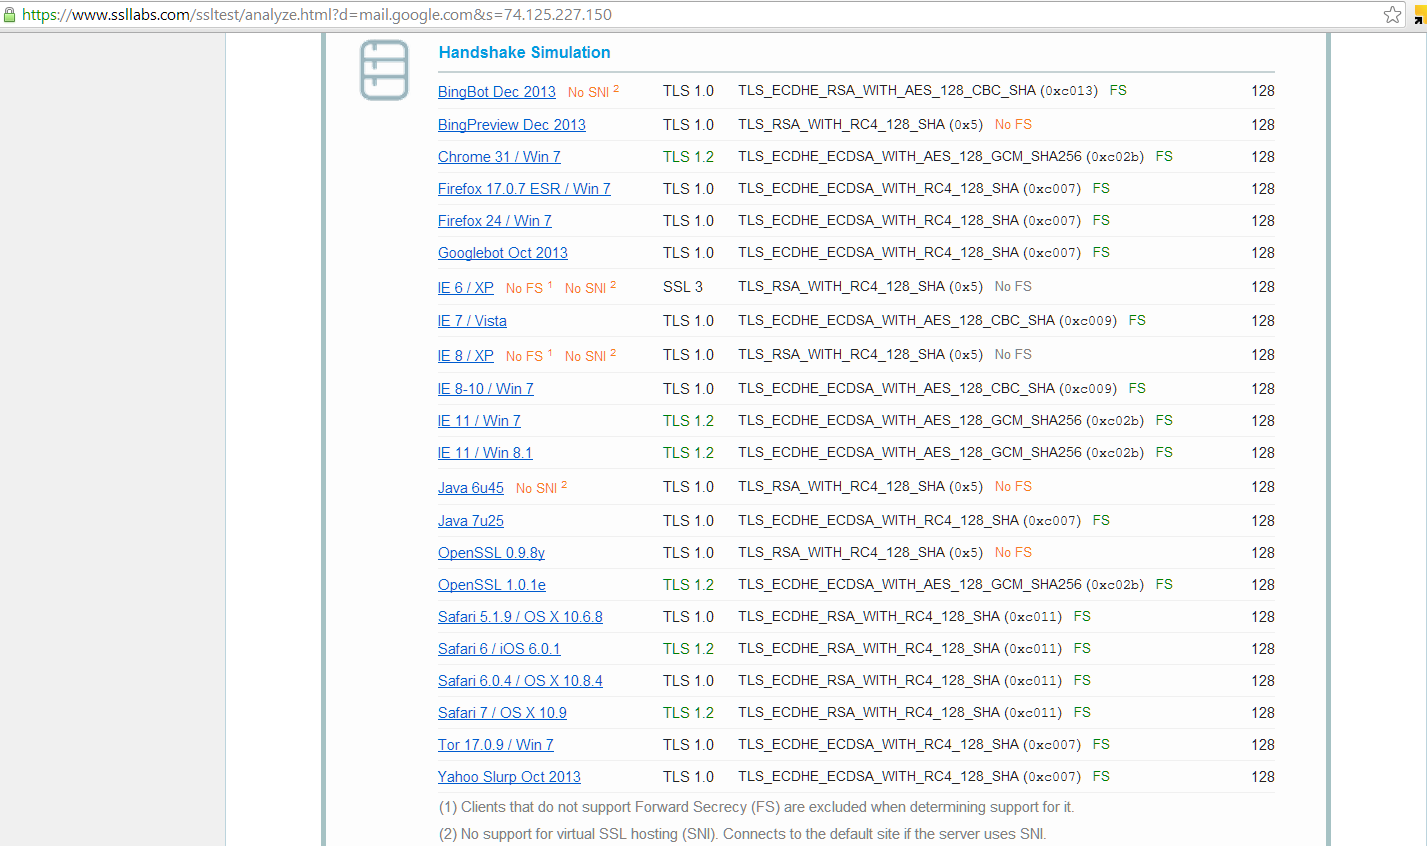
So, how can you test if a website uses forward secrecy or perfect forward secrecy? Check out Qualys' SSL Labs. When you run a report on a domain, there's a check to see if it supports Forward Secrecy. Since there was a recent article about Yahoo enabling HTTPS by default for its mail service, let's run a report:

Looks like Yahoo isn't there yet. How about GMail?
What's the main hesitation and why wasn't it already implemented? Performance. By increasing the number of keys, we're adding more overhead to the server. In spite of that, I think we can safely predict that this is a feature that will be gaining steam in 2014.
Reference:
http://news.netcraft.com/archives/2013/06/25/ssl-intercepted-today-decrypted-tomorrow.html
Read More
The Basics
First, a review of the OSI model. This model sets out a visual representation of what happens when information is transmitted from one system to another, such as when your home computer, laptop, or tablet loads a web page. Think of the OSI model as an information workflow process that systems use to either receive data or send it out. The model is organized into 7 layers, depicted here:
The mechanisms of HTTPS, SSL, and Perfect Forward Secrecy take place at the top three layers: Application, Presentation, and Session. More specifically, and for the sake of simplification, we'll say they happen at the Application and Session layers.
When you sit down at your machine and are ready to perform some online banking or shopping, this is what typically happens. You type in your bank's website, and your machine sends an HTTP request to the banking or ecommerce site.
It's at this stage where the bank or ecommerce site will send a redirect message to your browser (Internet Explorer, Chrome, Firefox, etc) providing instructions to contact the server back using an HTTPS request. Let's narrow our scope down on that part of the conversation:
When communicating sensitive information such as banking (account numbers) or ecommerce (credit card numbers), we don't want that data to be passed "in the clear" because someone could easily see what we're typing. Banks and retail stores don't want to be held accountable for letting someone steal your data, so they attempt to secure the communication when you access the portal. That's why in the graphic above, when you send a "clear text" request, the organization's server will typically send your browser an instruction to send a new request in a secure way. The browser knows where that new location is via the location response header.
Now our browser will begin secure communication negotiation with the banking or ecommerce server. Before the browser sends the request for the web page again, it establishes an agreed-upon secure communication method with the server.
Notice how in the graphic above I only focus on the SSL part of the conversation? It's important to note that SSL is independent of the HTTP application protocol. You can send other types of traffic over SSL such as File Transfer Protocol, Internet Content Adaptation Protocol, and Simple Mail Transfer Protocol. When we think of our banking and ecommerce sites, we always see the https, which is HTTP over SSL. Below is an illustration, using the same example above:
The Details
Now on to [Perfect] Forward Secrecy. What exactly does it mean, and why do I bracket out the "Perfect"? Perfect Forward Secrecy (PFS) is a level up from Forward Secrecy (FS), and both are improved where no implementation at all is used.
How do they protect the encrypted traffic? Using the Diffie-Hellman exchange, they ensure that the keys exchanged between "Home PCs" and servers are done so in a secure manner. It's a psuedo-randomization of the session key so that the asymmetric keys can be exchanged.
To clarify, in the picture above where we see the SSL session established, without using PFS or FS the server would not randomize the keys, using the same keys in conversations with however many "Home PCs" wanted to communicate.
 |
| NOTE: The "same" key is depicted above via the color purple |
The danger of handling encryption/decryption of SSL messages this way is that if the private key is compromised in anyway, all traffic collected using this keyring could then be decrypted.
Using Forward Secrecy, each conversation with each different "Home PC" would use the Diffie Hellman algorithm set to generate random session keys to determine the secure key exhange of the RSA keyring. Because the key exchange mechanism is different per "Home PC", gaining access to the private RSA key would have to be run through the Diffie-Hellman algorithm to find the key exchange used for each session.
Now, running the recovered (hacked?) private key along with the Diffie-Hellman algorithm would only reveal communication between that one "Home PC" the key was cracked for and the server.
And lastly, Perfect Forward Secrecy uses different session keys within the same conversation with each "Home PC" so that multiple keys are used per conversation:
So, what does this mean in terms of security?
We eliminate the capability of someone without key-breaking tools to eavesdrop when we switch from HTTP to HTTPS. SSL without PFS or FS means that if someone is able to crack the key used, then they have access to all conversations between that server and all systems with which it communicates. SSL with Forward Secrecy operations prevent all conversations from being monitored by the cracking of one key, but if someone does crack that key, then they would get access to all conversations between that server and one endpoint. Finally, SSL with Perfect Forward Secrecy ratchets up the difficulty even more, because now an eavesdropper must crack multiple keys within a single conversation.
The focus here is the number of keys involved, and increasing the number of keys increases the time it takes to break those keys.
Self Assessment
So, how can you test if a website uses forward secrecy or perfect forward secrecy? Check out Qualys' SSL Labs. When you run a report on a domain, there's a check to see if it supports Forward Secrecy. Since there was a recent article about Yahoo enabling HTTPS by default for its mail service, let's run a report:
Looks like Yahoo isn't there yet. How about GMail?
What's the main hesitation and why wasn't it already implemented? Performance. By increasing the number of keys, we're adding more overhead to the server. In spite of that, I think we can safely predict that this is a feature that will be gaining steam in 2014.
Reference:
http://news.netcraft.com/archives/2013/06/25/ssl-intercepted-today-decrypted-tomorrow.html
Subscribe to:
Posts
(
Atom
)


